The effects of the state of alarm on noise pollution
The unprecedented Covid-19 health crisis and the declaration of the state of alarm in the Spanish state, placing restrictions on movement, industrial and leisure activities, have led to sharp reductions in environmental acoustic contamination.
Two roads were analysed: an urban road and an interurban road with high noise levels caused by heavy traffic in the municipality of the Barcelona province. They are equipped with acoustically monitored solutions and analyse data with type 1 noise sensors.
KENOISE. (https://www.keacoustics.com/en/kenoise-en/
Figure 1 displays an evolution of the equivalent A-weighted value of the urban road throughout the whole month of March and the first 20 days of the month of April. During the first weeks of March, typical behaviour was observed: generally, there was traffic noise from 7 am to 11 pm with a substantial reduction at the weekend. From 13th March, the beginning of the partial lockdown period, a notable decrease in sound pressure could be observed until April 1st, which marked the beginning of the total lockdown. After 13th April, the second phase of partial lockdown, the values do not vary remarkably.
The peaks in noise levels can be clearly observed at 8 pm when the population paid tribute to the healthcare workers fighting on the front lines of the pandemic.

Figure 1 Evolution of the equivalent A-weighted value – Urban Road
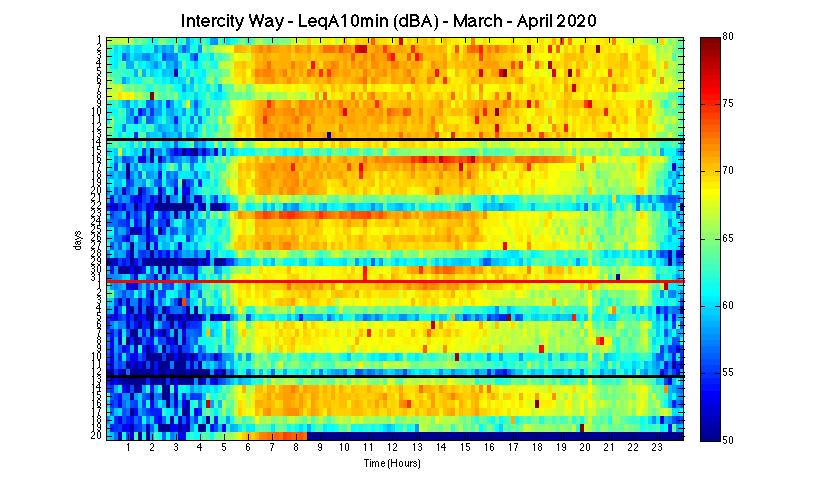
The effect of the state of alarm can also be seen on the interurban road (see Figure 2), especially during the phase of total lockdown. The tribute to the healthcare workers at 8 pm also appears less intensely potentially due to the area being less densely populated.

Figure 2 Evolution of the equivalent weighted level A – Interurban Road
In relation to the indexes of each time period according to European Directive 2002/49/CE: , there is a decrease as lockdown becomes stricter. Figure 3 shows details of the values taken from the monitored points on both roads during the months of March and April. The changes in the patterns can clearly be identified in each phase of lockdown.
The numbers in Figure 4 and Figure 5 show average values for both roads over the 3 periods in the 4 phases with a noticeable downwards tendency as lockdown gets stricter.

Figure 3 Evolution of level Ln . Dark green: Urban Road. Light green: Interurban Road

Figure 4 Evolution of the indexes Ld, Le and Ln averaged in the different phases. Urban Road.

Figure 5 Evolution of the indexes Ld, Le and Ln averaged in the different phases. Interurban Road.
Finally, Figure 6 shows the reduction arising in each phase of lockdown on both roads and during all periods. On the urban road, total lockdown led to a reduction of between 2 and 3 dBA during the day, between 5 and 6 dBA during the evening and between 4 and 5 dBA at night. On the interurban road, the reduction is 3 dBA during the day, between 4 and 5 dBA in the evening and 3 dBA at night. On both roads and during all three periods, the reduction in the second partial lockdown is greater than the first.

Figure 6 Reduction of the indexes Ld, Le and Ln in partial and total lockdown. Urban and Interurban Road.
Barcelona
Telèfon +34 605 431 416
Formem part de
![]()
![]()
![]()